
A version of this blog ran on the National League of Cities Institute for Youth, Education & Families website here.
The National League of Cities Reengagement Network recently released two new tools that will help reconnect opportunity youth to even more education pathways. They profile work being done to reconnect opportunity youth who lack a high school credential to education options that help them complete their educations. The annual Reengagement Census catalogues K12 student reengagement initiatives, with data from 20 sites in 2017. The Return on Investment Tool helps city and state policymakers, and educators quantify the impact of reengagement investments.
Students in reengagement programs often face barriers to success, including the need to support their families through part-time and full-time work. Opportunity youth many times may also have a disability, or face transportation challenges, juvenile justice involvement, childcare needs, and behavioral health issues.
Each reengagement center and program in the network has a customized model to best meet the needs of the community it serves. In particular, reengagement center staff reach out and connect with opportunity youth, assess students’ educational and other needs, and provide referrals to best-fit educational options as well as wraparound services.
Top-line findings from the Reengagement Census indicate that:
- Reengagement Network programs reached out to more than 40,000 students not connected to education;
- 38,737 students completed the intake process at the reengagement center or program;
- Reengagement programs placed at least 16,814 students into education programs;
- 11,737 students brought back to education options via systematic reengagement efforts graduated, obtained a high school diploma or equivalency diploma during the year; and
- Program data show a 69.8 percent aggregate “stick rate,” defined as still enrolled or have completed a credential by July 2017.
The Reengagement Census also collected demographic information, including the race and ethnicity of the students who were placed. Here is a graphic indicating that relative to the 2015-2016 census, the latest census saw sites reenrolling higher percentages of Hispanic/Latinx, White, Multiracial, and other students, while showing lower percentages of Black and Asian/Pacific Islander students.
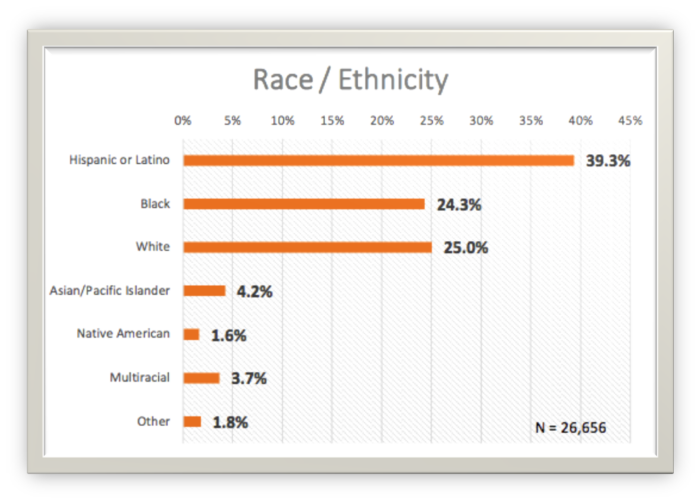 The decrease in Black students likely reflects the statistical impact of including figures from one large network with a large proportion of White and Hispanic/Latinx students, which had not reported in years prior. Outreach to Hispanic/Latinx students may also have increased overall. Note: These figures do not reflect a calculation of reenrollment rate by race or ethnicity. (Additional demographic data can be found on page 4 of the Reengagement Census.)
The Return on Investment Tool combines calculations by prominent labor economists of savings and foregone costs of reengagement efforts with census data from reengagement centers; this results in estimates of short- and long-term returns. For example, each high school graduate who returns to school through reengagement efforts saves local taxpayers an average of $65K, even before calculating the taxes those graduates pay when working. Users may modify the tool to use their own budget, student graduation, and funding data. The tool specifies how costs of reengagement programs lead to social and economic returns in the form of increased earnings, decreased spending on public safety, improved health outcomes, additional school district funding, and savings to taxpayers.
Both of these tools can be used to help municipal leaders and partners advocate for additional infrastructure that would advance youth workforce development priorities for opportunity youth in the form of reengagement centers and alternative schools.
The Reengagement page of the National League of Cities Institute for Youth, Education & Families (YEF) contains the Reengagement Census along with reports dating back to 2013.